Debugging a script
Debugging a script
By default, all script related logging is done using the autoscript logger. Each script can be configured at different log levels like DEBUG,INFO,ERROR, and so on. The default setup for any script is at ERROR, which can be changed from management application or at the time of creation in the second step of the wizard. If you were to debug the following script:
y=float(iplr)+float(olr)if y!=float(plr):pnr=str(y)
You put the following debug statements:
print "iplr="+iplrprint "olr="+olry=float(iplr)+float(olr)print "y="+yif y!=float(plr):pnr=str(y)print “pnr=”+pnr
You must make sure that the log level for the autoscript logger is set to the log level of the script. For example, set both of them to INFO. This will result in the print statements to show up in your systemout log. If required, the log statements produced by this logger can be re-directed to a dedicated log file holding only script-related log statements. The syntax of the print statement depends upon which language the script is being written with. Also, if the “autoscript” logger is set to ERROR level logs only, then the print statements inside the automation script will not be written to a log file.
This way of logging is not ideal as the scripting framework would not log this in real time.
It will log it after the script execution completes.
This does not create an ideal debugging session, especially for long running scripts.
Script developers should leverage the service.log set of APIs to log real time.
Recent enhancements allow the logger to be set at the individual script scope.
All you should do is create a logger with the script name and set the log level accordingly.
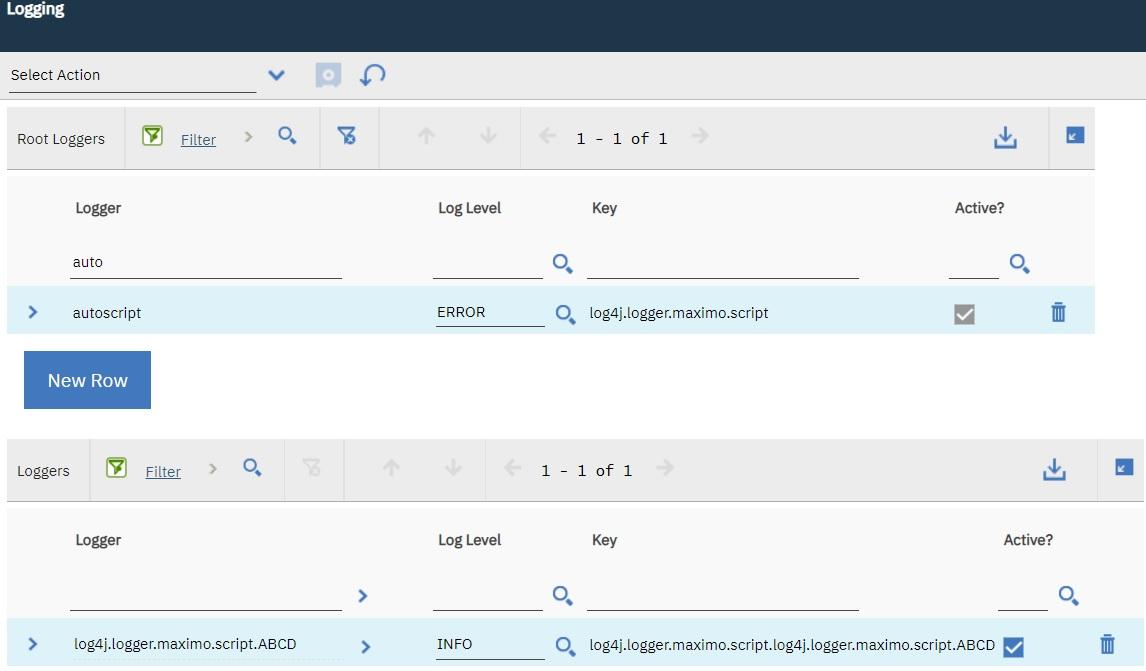
In the following screenshot, you create a logger for a script called ABCD and set the log level to INFO.

The base autoscript logger is set at ERROR level. Now, set the script ABC log level to INFO from the Automation Script application. Use the following script code:
service.log("hey there - I am in Asset "+mbo.getString("assetnum"))
You bind this script to ASSET Init event using Object launch point. When you initialize assets, for example, from the list table in ASSET application, you will see this log in real time. However, other scripts would not show any logs as the logger is set only for the ABCD script.
Ideally, there should be some form of support for remote debugging using breakpoints from an IDE. Currently, there is no support. There is remote debugging support for Nashorn js from IDEs like IntelliJ but this is not verified.
Logs from scripting framework
The scripting framework logs cover script loading, initialization, execution time and so forth. To see the values being passed received by script variables, set the autoscript logger to ‘DEBUG’, apply the logging settings and run the script configuration. Variable values should be output to the log file or system console. As a general rule of thumb, you can set the autoscript logger to INFO during script development or debugging time and set individual scripts log level to INFO too, which will push the script specific print statements to the log file. The following list of log information is automatically generated at the DEBUG level from the scripting framework.
Launch point name and script name that are about to be executed.
Script execution time as time elapsed between start and end of script execution.
Application name, logged in use name, MBO name, MBO unique ID values always injected as implicit data to the script. The script author may or may not use these.
Variable values passed into the script based on variable bindings. These are variables that are sourced from MBO attribute, MAXVAR, system property, or literal.
To redirect your scripting logs to a separate log file:
Go to Logging app.
Click Manage Appenders from the Select Action menu.
Click New Row in the Manage Appenders popup dialog.
Specify details as:
Appender = ScriptingOnly [or any appropriate name you choose]
Appender Implementation Class = psdi.util.logging.MXFileAppender [you can select this from the value list]
File Name = autoscript.log [or any appropriate file name you choose]
Accept all other defaults.
Save the new appender by clicking OK.
Locate ‘autoscript’ logger in the Root Loggers section of the application.
Click the Manage Appenders icon to the right of Appenders field in the Details section for ‘autoscript’ logger.
Select only the appender you created earlier, which is ScriptingOnly, and de-select any other appender previously associated with this logger.
Click OK to save the new association. From the Select Action menu click Apply for the log settings to take effect.