Meters Example
Component Life Accounting
This page gives an example of how asset meter readings are used and how meter totals are calculated for configuration-managed assets. It demonstrates how meter readings entered against a parent assembly are considered along with the configuration history of the child asset. It also gives an intitial insight into how these totals are considered as part of the maintenance plan for components.
Let's take an example for a Train:
The train consists of a number of cars, the first of which is the Driver Motor Power Car. Within the car are two Motor Bogies which form part of the propulsion system for the train. The number of kilometers travelled is recorded against the top level train asset using the "ODOM-KM" continuous meter.
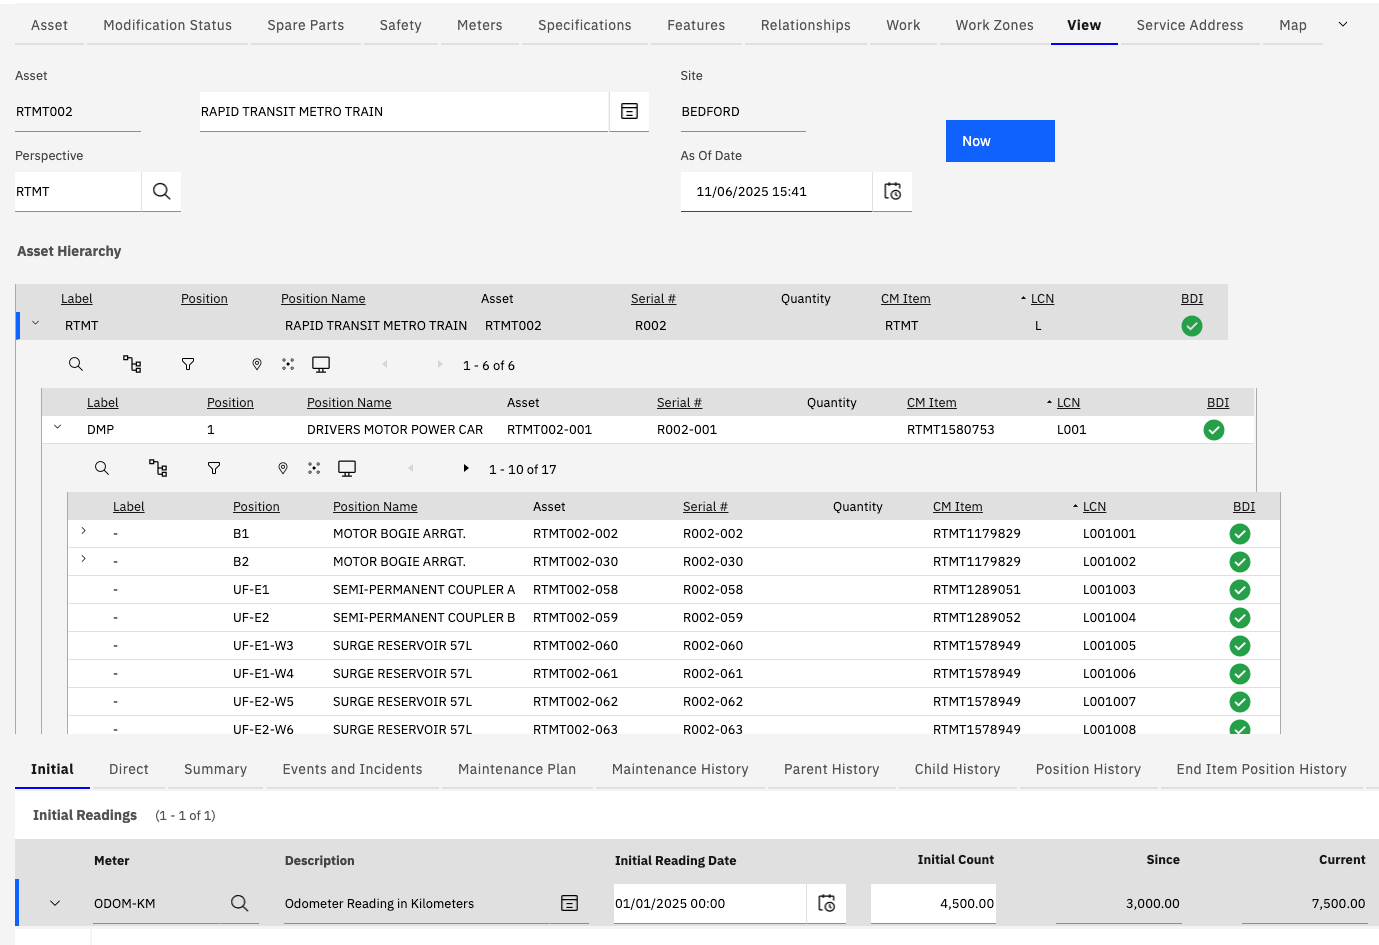
Intial Tab
Figure 1. Shows the "Initial" tab with the Train asset selected in the Asset Hierarchy view within the "Assets (CM)" application.
We can see that an initial count of 4500 KM has been recorded against the train.
The initial count is used to provide a baseline as to the life of the asset when it begins being managed in the Maximo system.
The "Since" value shows that a further 3000 KM have been recorded against the train since it began operation.
Figure 1.
Direct Tab
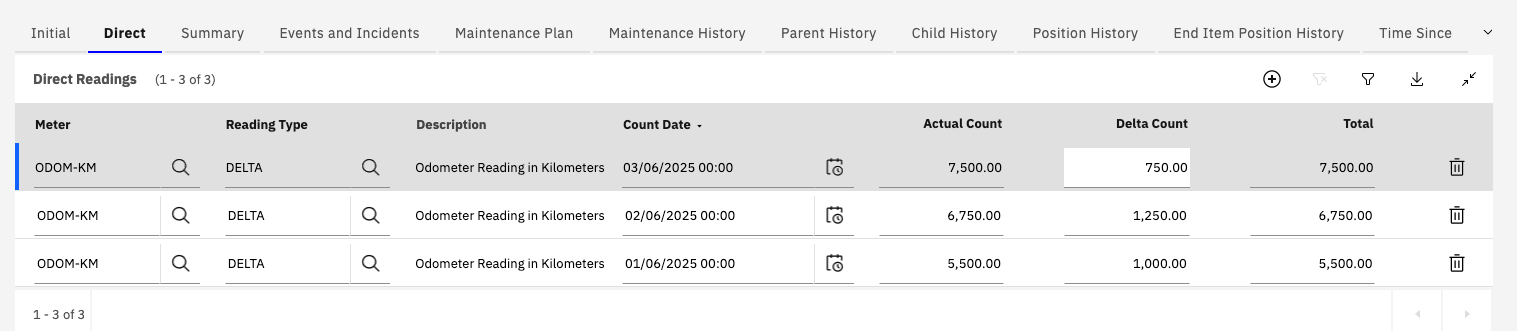
Figure 2. Shows three meter readings that have been entered against the same train asset. The readings are of type "DELTA" and the sum of these readings plus the Initial Count gives the total KM value of 7500 for the train.
Figure 2.
Summary Tab
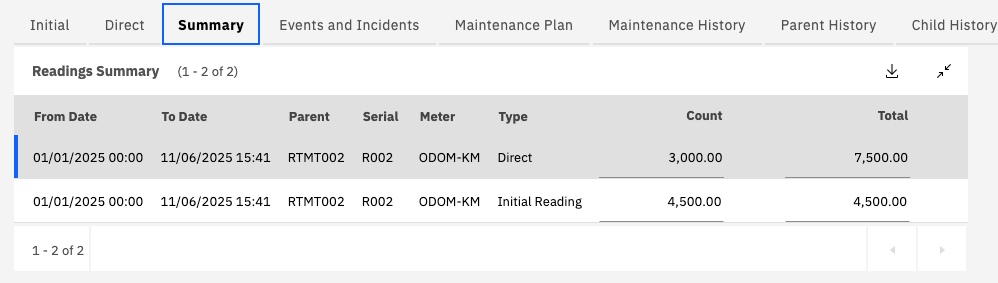
Figure 3. Shows the "Summary" tab for the train asset.
This provides a summary of the meter readings entered against the asset (Direct) and the initial reading.
For child assets this summary may also show an "indirect" row. This provides a total for the meter units inherited based on where the asset has been installed throughout its life.
Figure 3.
Inherited Readings
If we now look at the same information for a Motor Bogie asset installed into the first position in the Drivers Motor Power Car:
Figure 4. Shows the Initial tab for the Motor Bogie.
We can see that the Motor Bogie has a different Intial Count (5000) to that of the train it is installed into.
We can also see that it has an additional 9000 KMs that have been calculated for the Bogie to give a grand total of 14000 KMs.
Figure 4.
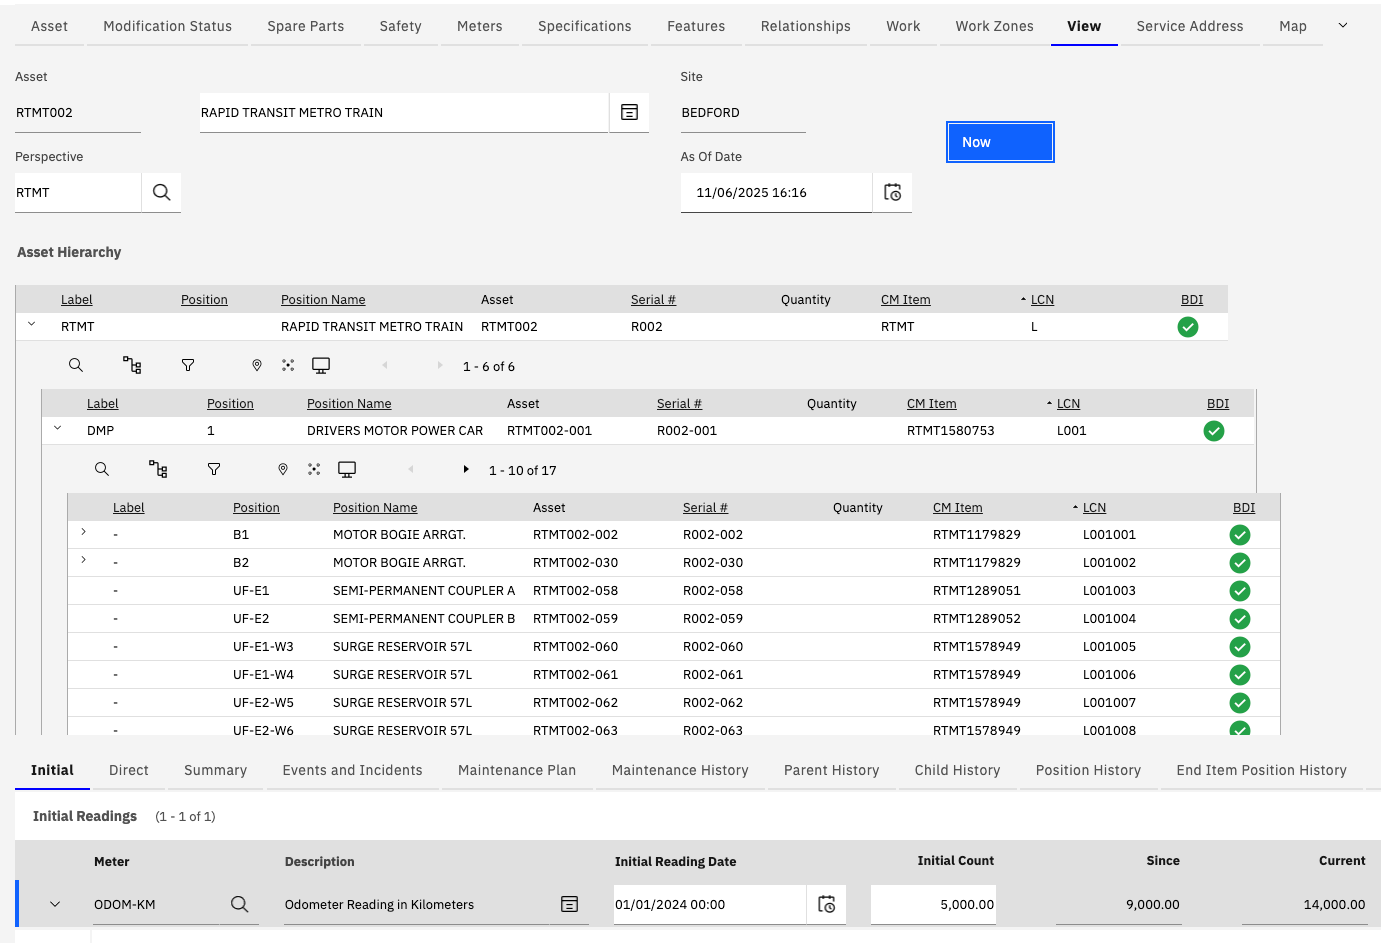
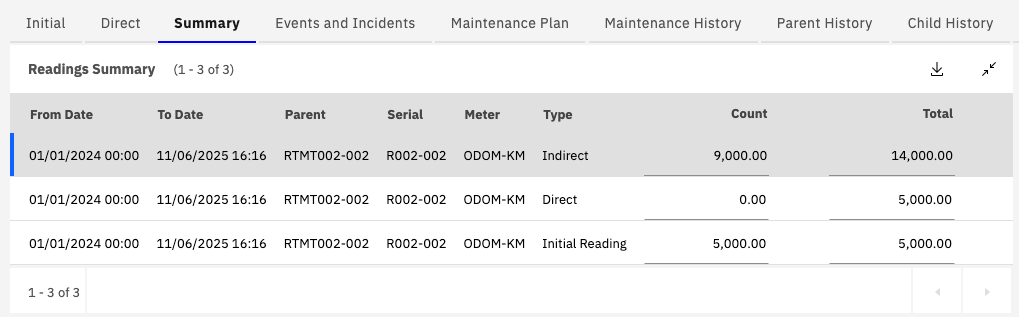
Figure 5. Shows the Summary Tab for the Motor Bogie. This time we see three rows:
- The Initial Reading Count of 5000
- A Direct Count of 0 (as no meter readings are entered directly against the bogie)
- An Indirect Count of 9000 indicating 9000 KM have been calcualted based on where the bogie has been installed over the course of its life.
Figure 5.
But where did the 9000 KM come from?
We demonstrated earlier how 3000 KM had been recorded against the train asset but this leaves a short fall of 6000.
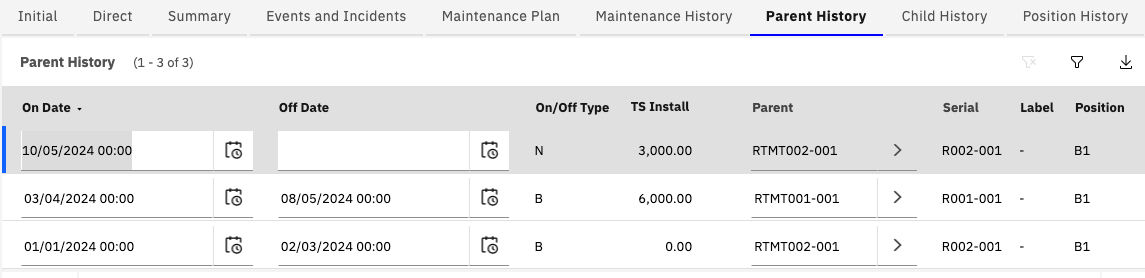
Figure 6. Shows the "Parent History" tab for the Motor Bogie. Here we can see where the Bogie has bee installed over the course of its life.
We can see the On and Off Dates of when it was installed and removed together with a "TS Install".
This "Time Since Install" gives a total value accumulated while the bogie was installed into a different train.
In this example the Bogie was installed in a different train (TRAIN B) between the dates 3 April 2024 and 8 May 2025. It's while installed in this second train that a total of 9000 KM was recorded against the train.
Figure 6.