Grafana Dashboard
Overview
When ACM is installed a dedicated BDI Grafana Dashboard will be automatically deployed to allow the monitoring of key BDI application metrics.
This assumes that Grafana is installed and configured on the Open Shift cluster.
The MAS Ansible Devops collection contains a role to automate the deployment of Grafana.
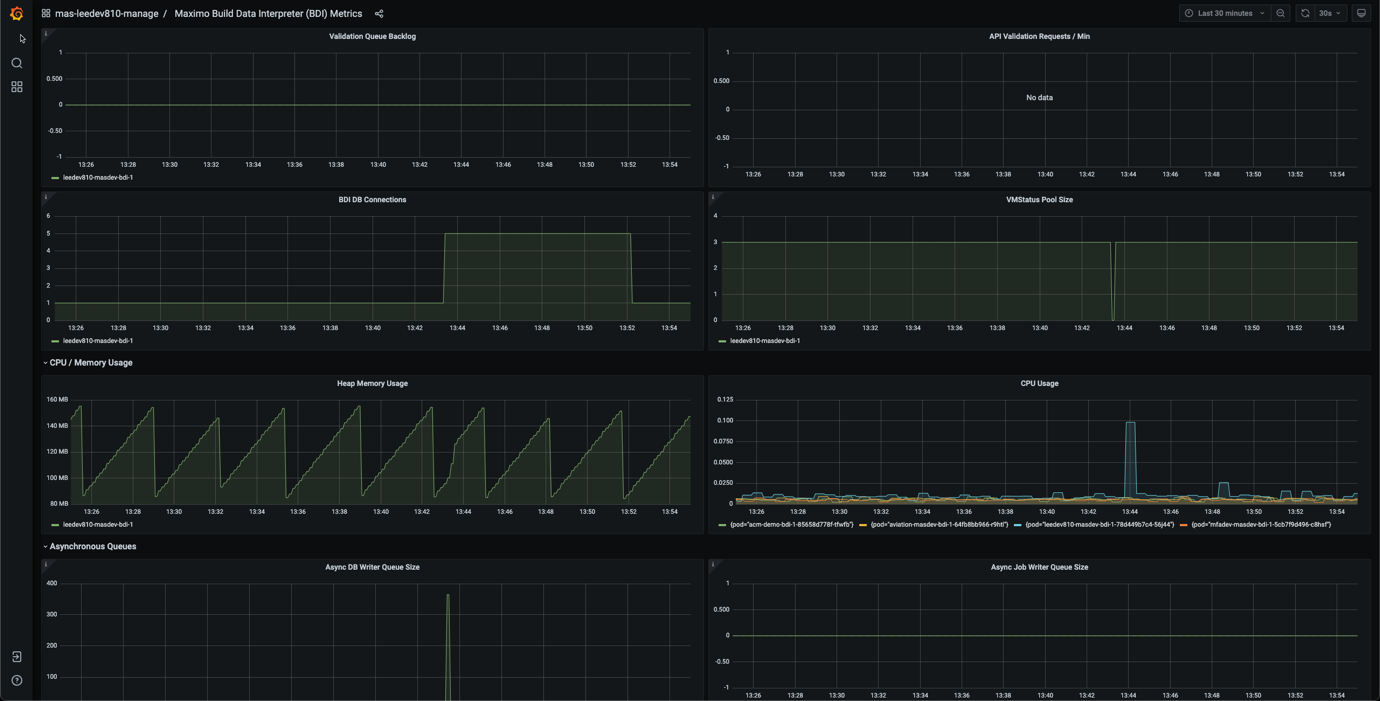
Explanation of Metrics
The key metrics displayed in the dashboard are described below:
Validation Queue Back Log:
Displays the number of records in the BDI queue with a status of PENDING or QUEUED.
A sustained large number indicates that the monitor process may be failing to keep up with the rate at which records are being placed into the queue by the system.
Solutions to this maybe increasing the number of monitor threads or configuring additional BDI instances.
API Validation Requests/min:
The number of requests to validate an asset per minute received by the BDI API. The API requests would normally come from usage of the Validate Configuration button in the BDI Status dialog.
BDI DB Connections:
Displays the current number of open database connections created by the BDI. The BDI operates a JDBC connection pool where new connections are opened depending on simultaneous validation request.
Connections which are open but have not been used in the last 5 minutes will be automatically closed.
VM Status Pool Size:
Displays the current number of cache objects in the cache pool used to service BDI requests.
Heap Memory Usage:
Displays Java Heap memory usage for all BDI pods.
CPU Usage:
Displays CPU usage for all BDI pods.
Async DB Writer Queue Size:
Displays the number of asynchronous database updates waiting for execution. Certain database updates performed by the BDI are performed asynchronously to optimize performance.
If the number of records displayed here is consistently high and never falls to zero it could indicate a requirement for additional BDI instances
Async Job Writer Queue Size:
Displays the number of asynchronous jobs waiting to be executed for insertion into the Maximo database.
If the number of records displayed here is consistently high and never falls to zero it could indicate a requirement for additional BDI instances.